
The Student's t-distribution is a continuous probability distribution that is used to estimate the mean of a normally distributed population when the sample size is small, and the population variance is unknown. It is often used in hypothesis testing and confidence interval estimation, particularly when the sample size is small and the population variance is unknown.
Properties of Student's t-Distribution:
The Student's t-distribution is defined by a single parameter: the degrees of freedom (df). The degrees of freedom represent the number of independent observations in the sample minus one. It has several important properties, including:
Continuous values: The Student's t-distribution is a continuous probability distribution, meaning that it can take any value between \(-\infty\) and \(+\infty\).
Symmetric: The Student's t-distribution is symmetric around its mean.
Heavy tails: The Student's t-distribution has heavier tails than the normal distribution, meaning that extreme values (far from the mean) are more likely to occur.
Asymptotic: The Student's t-distribution approaches but never reaches the x-axis as the values of x become increasingly large.
Approaches Normal Distribution: As the degrees of freedom increase, the Student's t-distribution approaches the normal distribution. This means that for large sample sizes (i.e., when df is large), the Student's t-distribution can be approximated by a normal distribution.
Probability Density Function (PDF) - Student's t-Distribution
The probability density function (PDF) of the Student's t-distribution gives the probability of a given value occurring within a certain range. The formula for the PDF is as follows:
$$\Large{f(t) = \frac{\Gamma(\frac{\nu+1}{2})}{\sqrt{\nu\pi}\Gamma(\frac{\nu}{2})}(1 + \frac{t^2}{\nu})^{-\frac{\nu+1}{2}}}$$
Where:
\(f(t)\) is the probability density function
\(\Gamma\) is the gamma function, which is a mathematical function used in probability theory and statistics
\(\nu\) is the degrees of freedom
\(t\) is the value of the random variable
\(\pi\) is the mathematical constant representing the ratio of the circumference of a circle to its diameter
t Test Statistic
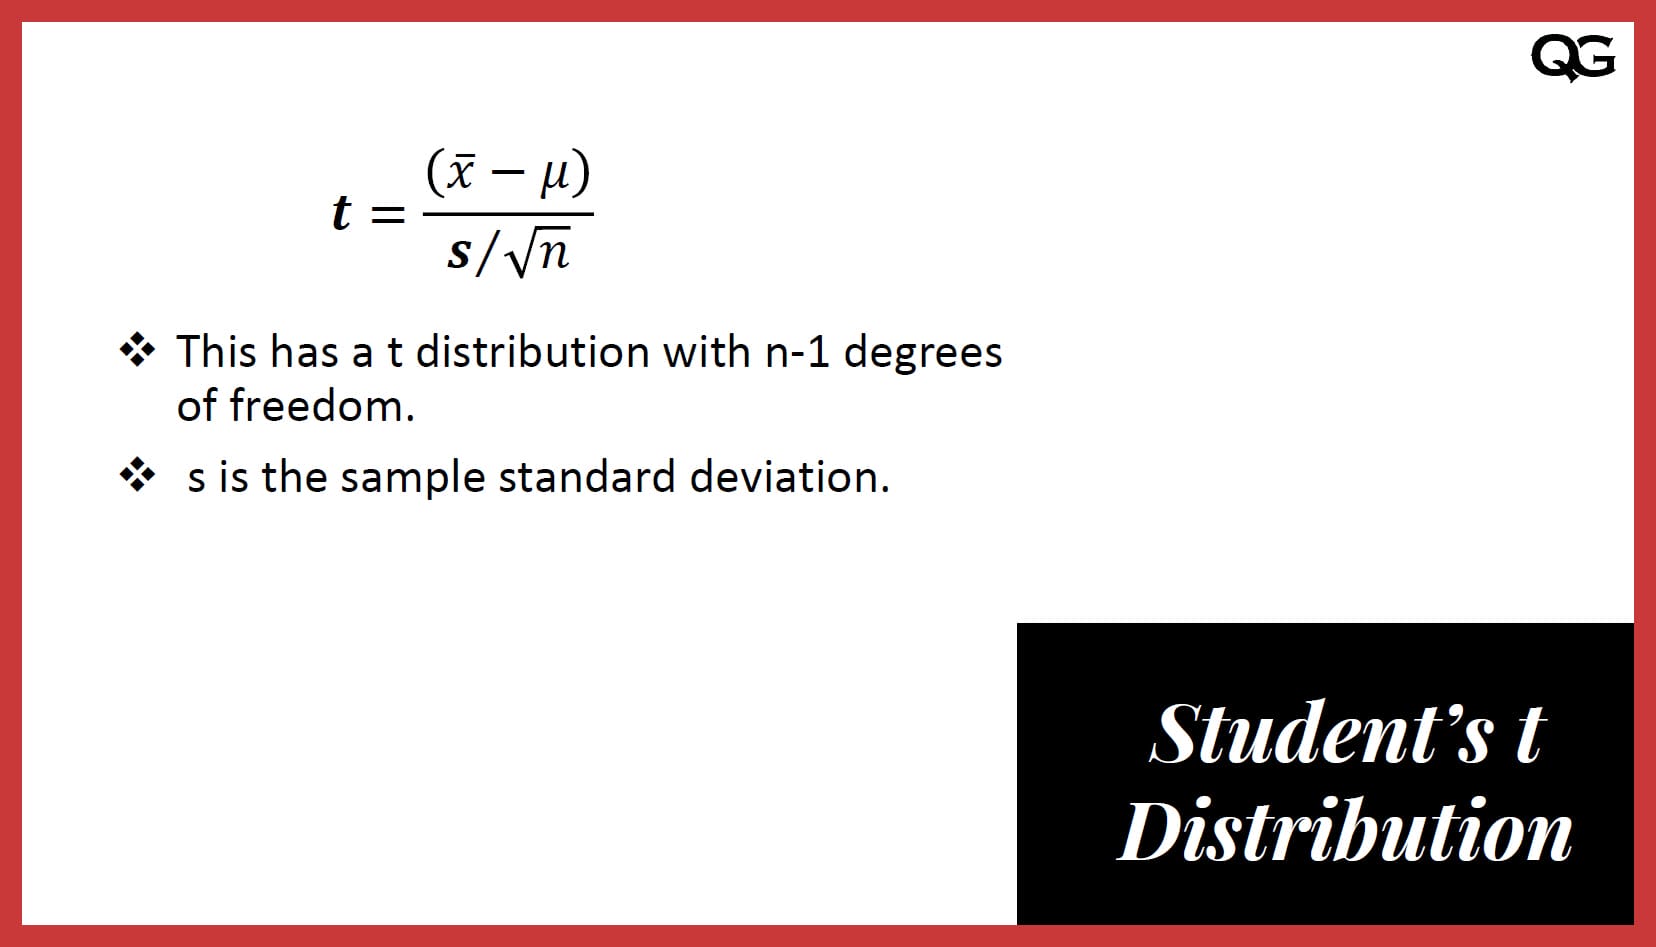
A t-test statistic measures how much the sample mean differs from the population mean. It is calculated using the following formula:
$$\Large{t = \frac{\bar{x} - \mu}{\frac{s}{\sqrt{n}}}}$$
In this formula, "t" is the t-test statistic, "\(\bar{x}\)" is the sample mean, "μ" is the population mean, "s" is the sample standard deviation, and "n" is the sample size.
The t-test statistic is calculated by subtracting the population mean from the sample mean and dividing the result by the standard error of the mean. The standard error of the mean is calculated as the sample standard deviation divided by the square root of the sample size.
The t-test statistic is used to determine whether the sample mean is significantly different from the population mean. If the t-test statistic is large, it indicates that the sample mean is significantly different from the population mean. The larger the t-test statistic, the more confident you can be that the difference between the sample mean and the population mean is not due to chance.
Student's t-Distribution Calculator:
Mean, Standard Deviation and Variance of Student's t-Distribution
The mean of a Student's t-distribution is 0, regardless of the number of degrees of freedom.
The standard deviation and variance of a Student's t-distribution depend on the number of degrees of freedom.
The standard deviation of a Student's t-distribution is calculated as the square root of the variance.
The variance of a Student's t-distribution with ν degrees of freedom is calculated as:
$$variance = \frac{\nu}{\nu - 2}$$
Where \(\nu\) is the degrees of freedom and \(\nu \geq 2\).
For example, for a Student's t-distribution with 10 degrees of freedom, the variance would be calculated as:
variance = 10 / (10 - 2) = 10/8 = 1.25
And the standard deviation would be the square root of the variance, which is:
standard deviation = √1.25 = 1.12
It's important to note that as the number of degrees of freedom increases, the variance and standard deviation of the t-distribution approaches the variance and standard deviation of the normal distribution, which are both equal to 1.
Using Microsoft Excel
Using Microsoft Excel to work with the Student's t-distribution:
T.DIST(x,deg_freedom, cumulative):
The T.DIST function in Microsoft Excel can be used to calculate the probability density function (PDF) or cumulative distribution function (CDF) of the left tail of the Student's t-distribution.
To use the TDIST(x, degrees_of_freedom, cumulative) function, you need to provide the following input arguments:
- x: The value for which you want to calculate the probability density or cumulative probability.
- Degrees of freedom: The number of degrees of freedom in the t-distribution.
- Cumulative: A logical value that specifies whether you want to calculate the PDF (cumulative = FALSE) or CDF (cumulative = TRUE)
For example, to calculate the probability that a value from a t-distribution with 10 degrees of freedom is less than 1.5, you would use the following formula:
PDF:
=T.DIST(1.5, 10, FALSE) = 0.127445
CDF:
=T.DIST(1.5, 10, TRUE) = 0.917746

T.INV(probability, degrees_of_freedom):
The T.INV function in Microsoft Excel can find the t-value corresponding to a given probability in a t-distribution. The function has the following syntax:
=T.INV(probability, degrees_of_freedom)
Where:
probability is the probability for which you want to find the corresponding t-value. This should be a value between 0 and 1. degrees_of_freedom is the number of degrees of freedom in the t-distribution.