
Hypothesis testing is a statistical procedure that allows us to test assumptions or beliefs about a population based on sample data.
There are two main approaches to hypothesis testing:
- Traditional approach and
- The p-value approach.
In the traditional approach, we find the critical statistics (based on a predetermined significance level) and decide to reject or fail to reject the null hypothesis based on whether the test statistic falls within or outside the critical statistic.
In the p-value approach, we calculate the probability of observing the sample data, given that the null hypothesis is true. Based on this probability, we decide whether to reject or fail to reject the null hypothesis.
In this post, we will explore the steps involved in both approaches to hypothesis testing.
1. Traditional Approach
The steps for conducting a hypothesis test using a test statistic and critical statistic (without using a p-value) are as follows:
- Specify the null hypothesis and the alternative hypothesis. The null hypothesis represents the default assumption that there is no significant difference or relationship between the variables being studied, while the alternative hypothesis represents the claim or hypothesis that the researcher is testing.
- Choose a significance level for the test. The significance level is the probability of making a type I error or rejecting the null hypothesis when it is true. A common significance level is 0.05, meaning there is a 5% chance of rejecting the null hypothesis when it is true.
- Collect a sample of data and compute the test statistic. The test statistic is a numerical value calculated from the sample data and used to evaluate the null and alternative hypotheses.
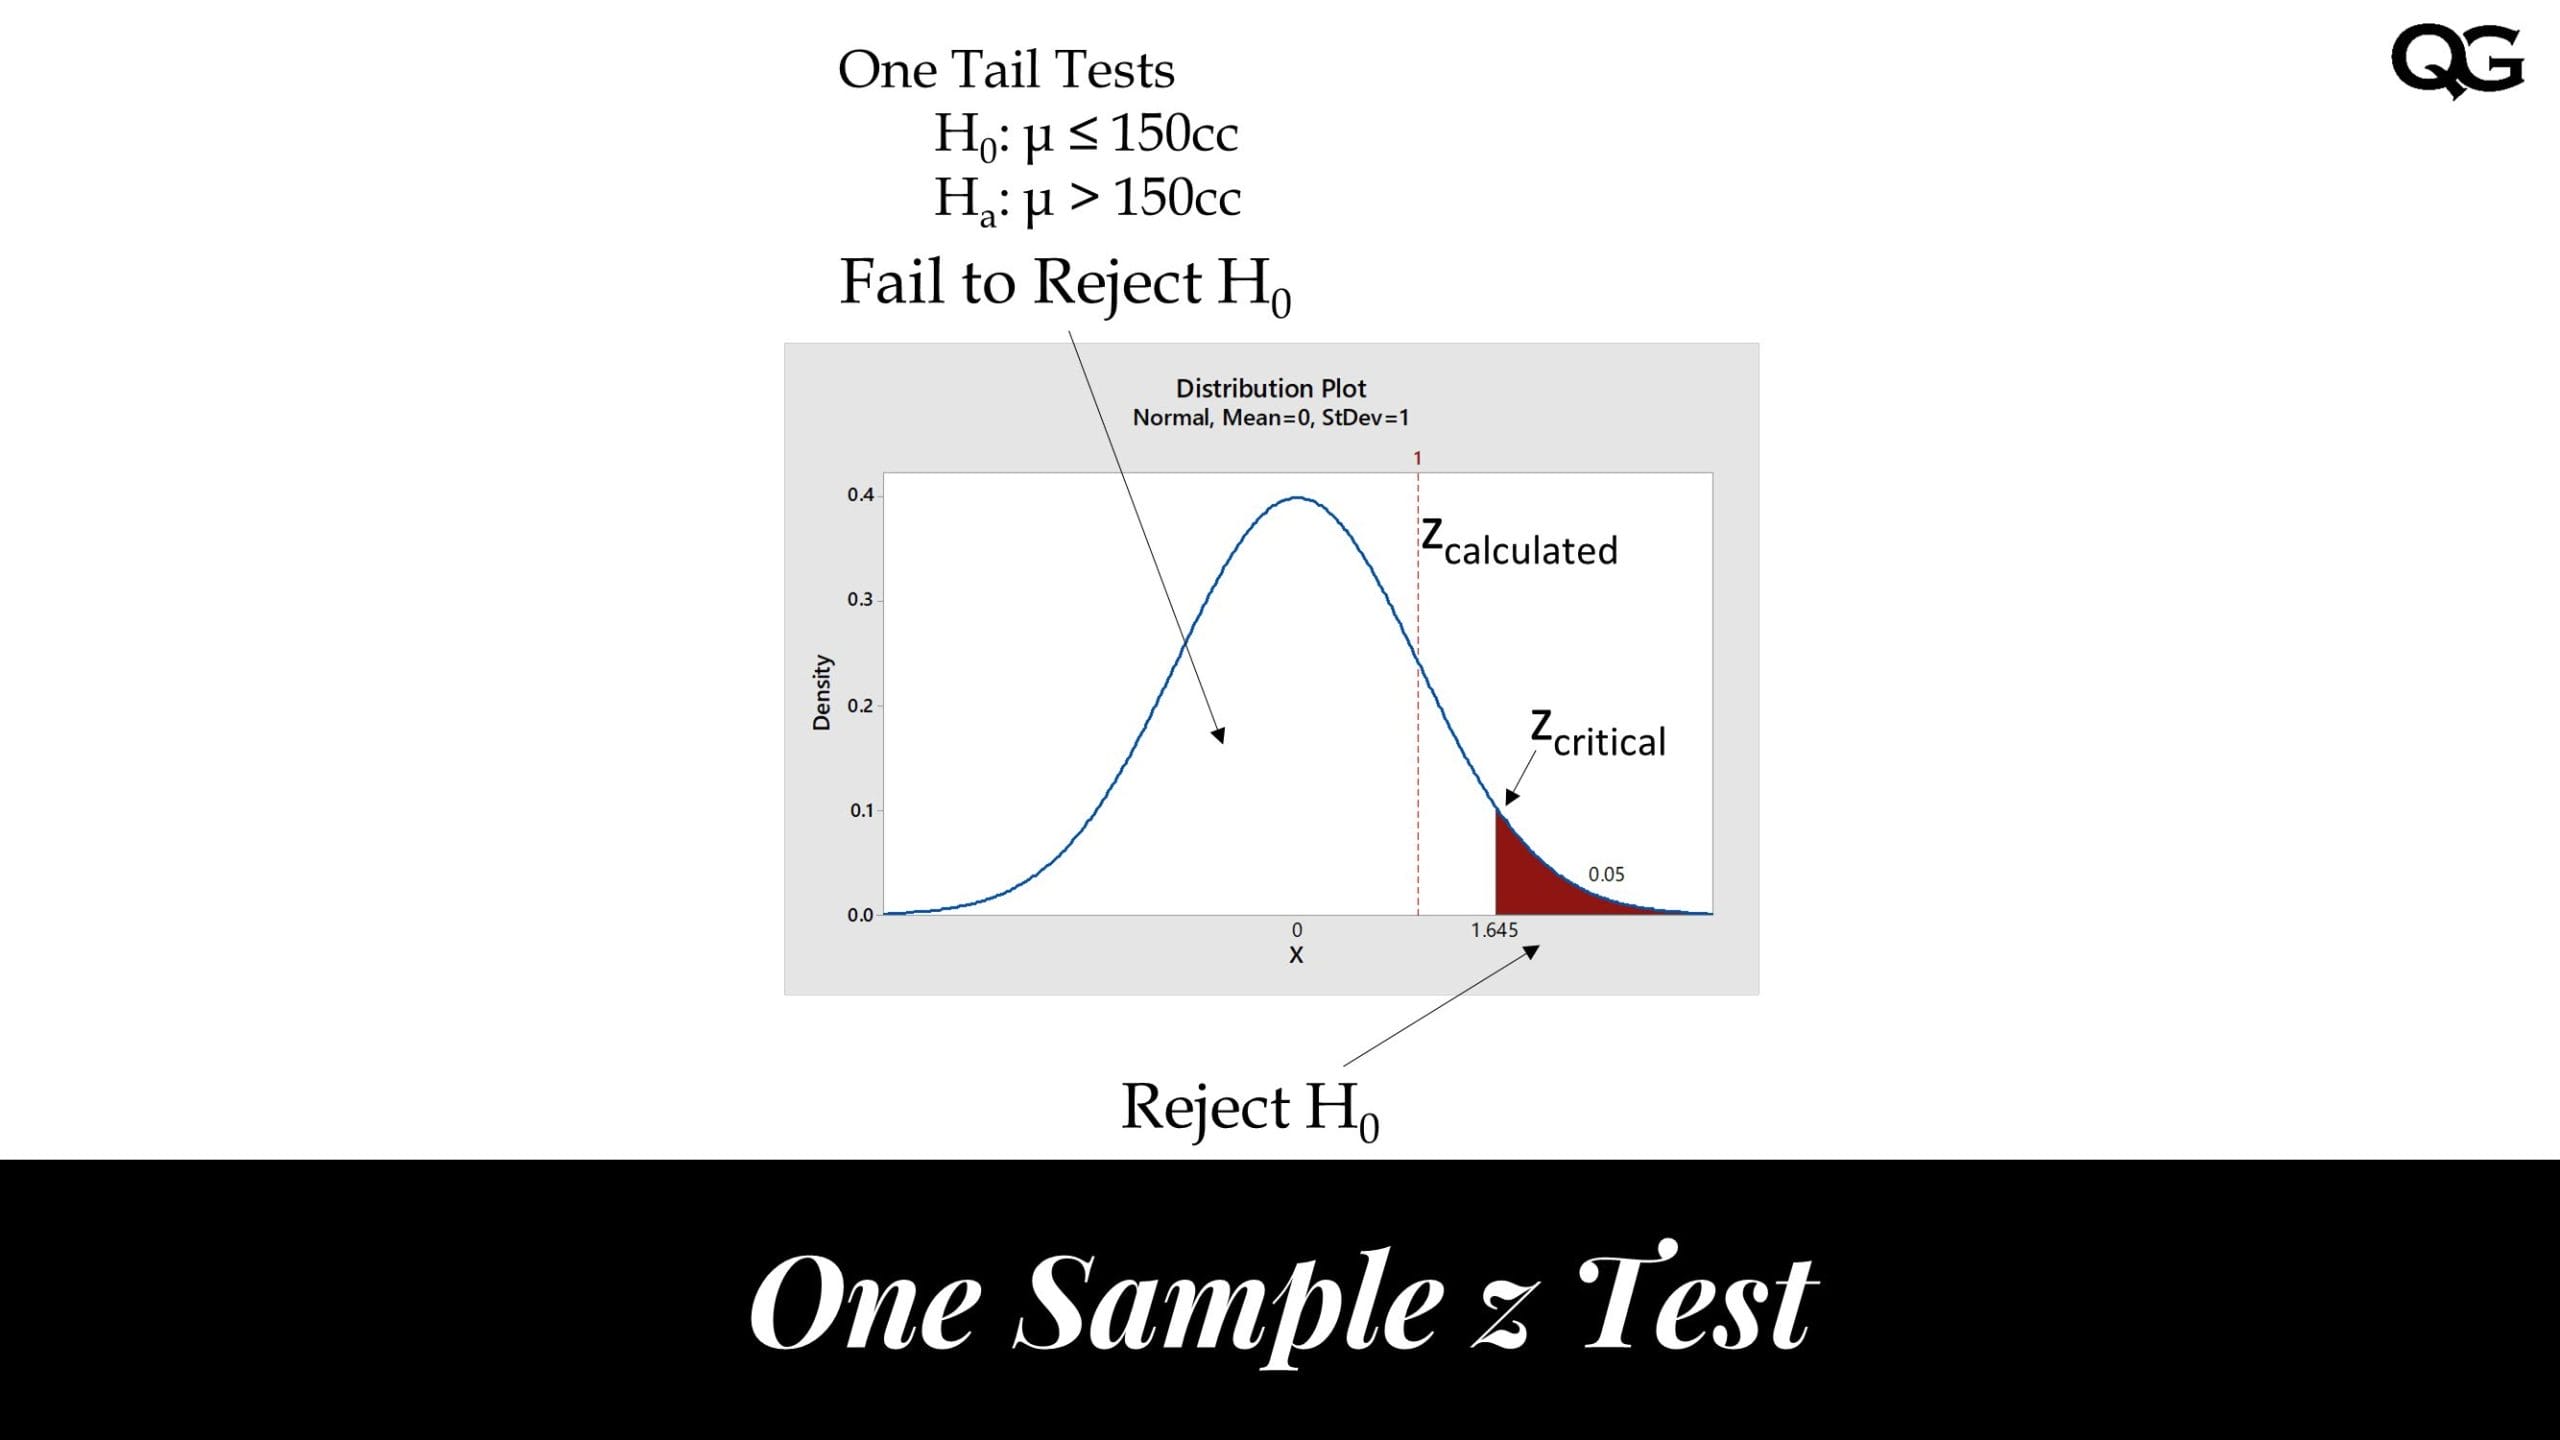
- Compute the critical value. The critical value is the threshold value used to determine whether the observed results are statistically significant. It is calculated based on the significance level and the assumed distribution of the data under the null hypothesis.
- Compare the test statistic to the critical value. If the test statistic is greater than or equal to the critical value, the observed results are considered statistically significant, and the null hypothesis is rejected in favour of the alternative hypothesis. If the test statistic is less than the critical value, the observed results are not considered statistically significant, and the null hypothesis is retained (or we fail to reject the null hypothesis).
- Interpret the results and draw conclusions. Based on the outcome of the hypothesis test, the researcher can make inferences about the population and conclude the validity of the null and alternative hypotheses.
These steps provide a general outline of the hypothesis testing process using a test statistic and critical value. Depending on the specific test being conducted, there may be additional steps or variations in the procedures for collecting and analyzing the data.
2. The p-Value Approach
In hypothesis testing, the p-value measures the strength of the evidence against the null hypothesis, which is the assumption that there is no statistical difference between the observed data and the expected results. If the p-value is small, it suggests that the null hypothesis is unlikely to be true. Most software applications use the p-value approach in hypothesis testing because it is a widely accepted method for evaluating the validity of a hypothesis.
The steps for conducting a hypothesis test are as follows:
- Specify the null hypothesis and the alternative hypothesis. The null hypothesis represents the default assumption that there is no significant difference or relationship between the variables being studied, while the alternative hypothesis represents the claim or hypothesis that the researcher is testing.
- Choose a significance level for the test. The significance level is the probability of making a type I error or rejecting the null hypothesis when it is true. A common significance level is 0.05, meaning there is a 5% chance of rejecting the null hypothesis when it is true.
- Collect a sample of data and perform the analysis.
- Compute the p-value. The p-value is the probability of obtaining the observed results by chance if the null hypothesis is true. It is calculated based on the test statistic and the assumed distribution of the data under the null hypothesis.
- Compare the p-value to the significance level. If the p-value is less than the significance level, the observed results are considered statistically significant, and the null hypothesis is rejected in favour of the alternative hypothesis. If the p-value is greater than or equal to the significance level, the observed results are not considered statistically significant, and the null hypothesis is retained. (If the p is low, the null must go; if the p is high, the null fly)
- Interpret the results and draw conclusions. Based on the outcome of the hypothesis test, the researcher can make inferences about the population and conclude the validity of the null and alternative hypotheses.
Conclusion
In conclusion, hypothesis testing is a statistical method used to evaluate the likelihood that a proposed hypothesis is true based on sample observations or data. There are two main approaches to hypothesis testing: the p-value approach and the critical value approach (also known as the traditional approach).
The traditional approach is typically used in manual calculations. In contrast, the p-value approach is invariably used when the hypothesis test analysis is done using software such as Excel, Minitab, R or Python.