

I have often been asked, why do we have 3.4 Defects Per Million Opportunities (DPMO) for a Six Sigma process?
Before I talk about Six Sigma, let's talk about the process control with plus-minus three sigmas. Historically processes were controlled in \( \pm 3\sigma \), and this was the basis of control charts.
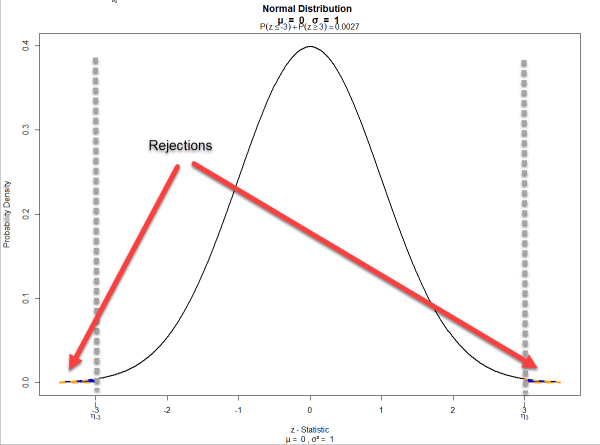
When you have a process, which is centered around the mean, it will have 99.73% items within \( \pm 3\sigma \) and will have 0.27% items outside the \( 3\sigma \) limits. Out of this 0.27 %, you will have half of the rejection (0.135%) on the lower end and another half rejection on the upper end. See the Normal Distribution curve below:
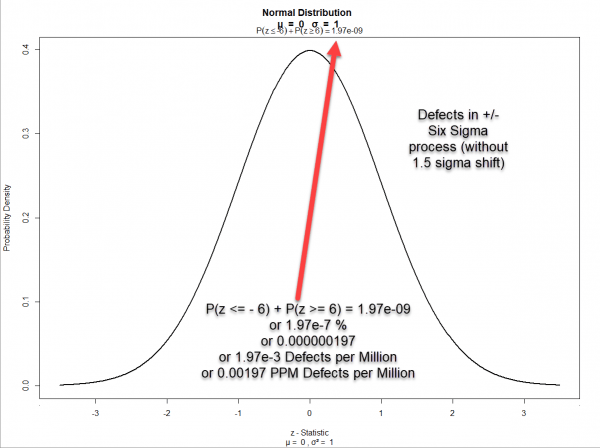
Now instead of \( \pm 3\sigma \), you look at the Normal Distribution curve, with \(\pm \)6\(\sigma \) you will see that the rejection area is 0.000000197% (or 0.00197 DPMO), and not 3.4 DPMO.
Now the question is, why do we get 0.00197 DPMO for a Six Sigma process instead of 3.4 DPMO?
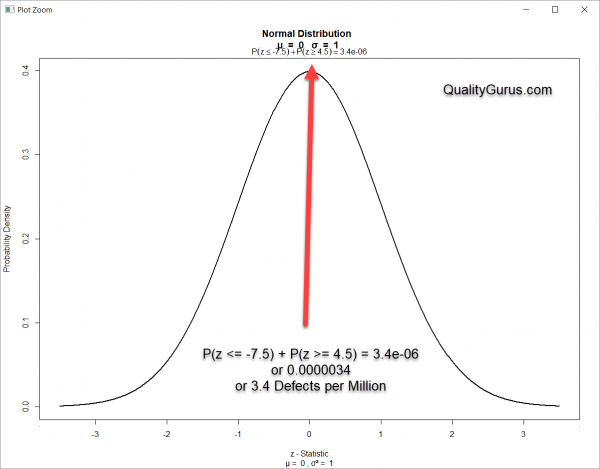
The answer to that lies in \(1.5\sigma \) shift allowed in the process over a long time. A Six Sigma process is allowed to move \(1.5 \sigma \) on both sides from the mean.
If for example, the process shifts \( 1.5 \sigma \) to the right, then we will be left with \( 4.5 \sigma \) (6.0 - 1.5) as the acceptance area in the right and \( -7.5 \sigma \) ( -6.0 - 1.5) on the left. With this shift, the rejection rate will be 3.4 DPMO. Similarly taking the other extreme case, where the process moves \( 1.5 \sigma \) to the left then also the rejection rate will be 3.4 DPMO. Both these cases are the worst case scenarios. Hence Six Sigma process has the maximum defects as 3.4 DPMO. See the calculations for \( 1.5 \sigma \) to the right, shown below:
Above plots were made using R Programming, and show the Normal Distribution curve with plus-minus three sigma limits only. However, the rejection area calculation is shown at the top of the chart. You can verify these numbers using the Normal distribution table or other software such as Microsoft Excel or Minitab.
DPMO to Sigma Level / Sigma Level to DPMO Converters
DPMO to Sigma Level / Sigma Level to DPMO Converters