
Process quality control is an essential aspect of manufacturing and service industries. Control charts have long been used to monitor and identify potential issues in these processes. The u chart, in particular, is a powerful tool for assessing the number of nonconforming items in a process over varying sample sizes. In this post, we'll explore the basics of u charts, how they work, and how to create one using a simple web application.
The u Chart:
The u chart, also known as the "defects per unit" chart, is a type of control chart used to monitor the number of nonconforming items per unit in a process. It is ideal for situations where the sample sizes differ from one inspection period to another. The u chart can help determine if a process is stable or if there are any special causes of variation that need to be addressed.
How the u Chart Works:
The u chart plots the number of nonconforming items per unit for each sample. The horizontal axis represents the sample number, while the vertical axis shows the number of nonconforming items per unit.
The centerline of the chart represents the average number of nonconforming items per unit, calculated as the total number of nonconforming items divided by the total sample size. Additionally, the chart features an upper control limit (UCL) and a lower control limit (LCL), which are used to identify potential outliers in the process. The UCL and LCL are calculated based on the average count and the sample size.
Formula and Calculation:
The centerline of the chart represents the average number of nonconforming items per unit (ū), calculated as the total number of nonconforming items (Σc) divided by the total sample size (Σn):
ū = Σc / Σn
Additionally, the chart features an upper control limit (UCL) and a lower control limit (LCL), which are used to identify potential outliers in the process. The UCL and LCL are calculated based on the average count (ū) and the sample size (n) for each data point:
UCL = ū + 3 * sqrt(ū / n) LCL = max(0, ū - 3 * sqrt(ū / n))
Using the u Chart Web Application:
Creating a u chart web application is made easy with HTML, CSS, and JavaScript, along with the Plotly library for data visualization. To use the application:
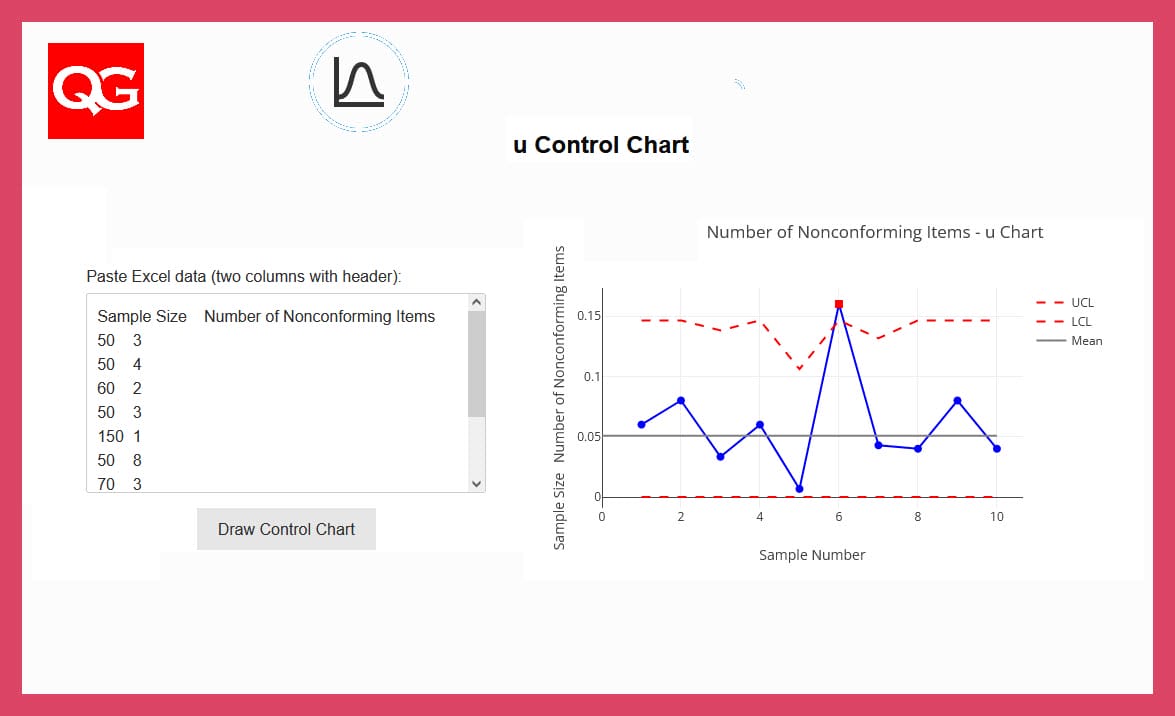
- Prepare your data in two columns: sample size and the number of nonconforming items. Ensure the data has a header row.
- Copy the data from a spreadsheet (e.g., Excel) or other sources.
- Paste the data into the text area provided in the web application.
- Click the "Draw Control Chart" button to generate the u chart.
The application will process the input data and display the u chart, highlighting points that fall outside the control limits. These points indicate potential issues in the process that may require further investigation.
u Chart Online Calculator:
u Control Chart
Conclusion:
The u chart is a valuable tool for monitoring the number of nonconforming items in a process with varying sample sizes. By understanding its fundamentals, formula, and creating a simple web application, you can effectively assess process quality and identify areas for improvement. With this knowledge, you can work toward ensuring a stable and efficient process that meets the required quality standards.