
1. Normal Distribution:
The Normal Distribution equation is given by:
$$ f(x) = \frac{1}{\sigma\sqrt{2 \pi }} e^{ -\frac{(x - \mu)^2}{2 \sigma^2}} $$
where μ is the mean, σ is the standard deviation, and x is the random variable. This equation describes the probability density function of the Normal Distribution, which is a continuous probability distribution that is symmetrical around the mean. It is often used to model real-world phenomena that are approximately normally distributed, such as height, weight, and IQ scores.
Where:
e ≈ 2.718
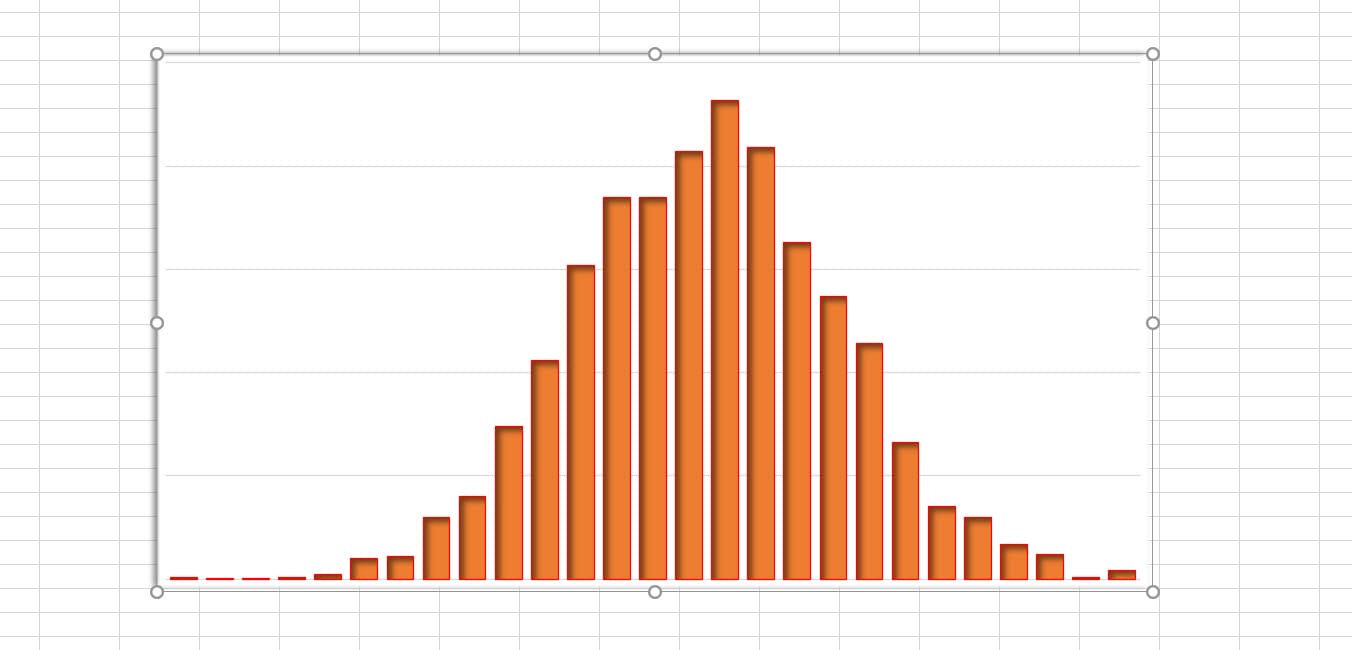
2. Binomial Distribution:
Where:
P(x) = Probability of x successes in n trials
The binomial distribution is a probability distribution that describes the number of successes in a fixed number of independent Bernoulli trials. The binomial distribution is defined by two parameters: the number of trials (n) and the probability of success (p) in each trial. The formula for the binomial distribution is as follows:
$${P(x)} = ^{n}{C_x}.{p^x}.{q^{n-x}}$$
where:
- P(X = x) is the probability of x successes in the given number of trials
- n choose x is the binomial coefficient, which is the number of ways x successes can occur in n trials
- p^x is the probability of x successes in n trials
- q^(n-x) or (1-p)^(n-x) is the probability of (n-x) failures in n trials
For example, if we have a binomial distribution with 10 trials and a probability of success of 0.5 in each trial, the probability of getting exactly 5 successes in those 10 trials would be:
P(X = 5) = (10 choose 5) * 0.5^5 * 0.5^(10-5)
= 252 * 0.03125 * 0.03125
= 0.207
Thus, the probability of getting exactly 5 successes in 10 trials with a probability of success of 0.5 in each trial is 0.207.
3. Poisson Distribution:
The Poisson distribution is a statistical distribution that can be used to model the number of occurrences of a given event in a fixed period of time, space, or area. It is often used to model the number of times a specific event occurs in a given period of time, such as the number of cars that pass through a particular intersection in an hour, or the number of calls to a customer service center in a day.
The formula for the Poisson distribution is:
$${P(x)} = {e^{-λ}}.\frac{λ^x}{x!}$$
where:
- P(x) is the probability of x occurrences
- λ is the average number of occurrences in the given period of time, space, or area
- e is the mathematical constant approximately equal to 2.71828
- x! is the factorial of x (the product of all positive integers less than or equal to x)
For example, if the average number of cars that pass through a particular intersection in an hour is 10, the probability of exactly 15 cars passing through that intersection in an hour is:
P(15) = (e^(-10) * 10^15) / 15! = (2.71828^(-10) * 10^15) / 15! = 0.000045
In other words, the probability of 15 cars passing through the intersection in an hour is very low, according to the Poisson distribution.