
Pre-control charts are used to monitor process performance by comparing actual results against specifications. They provide a visual representation of whether processes are within specification limits.
They use specification limits instead of statistically-derived control limits to determine process capability over time. They can be used during the initial setup process when you do not have enough data to calculate the process control limits.
The purpose of pre-control charts is to show if a process is operating within its specification at any given point in time and to indicate when it will fail or exceed its specification limit.
How does it Work?
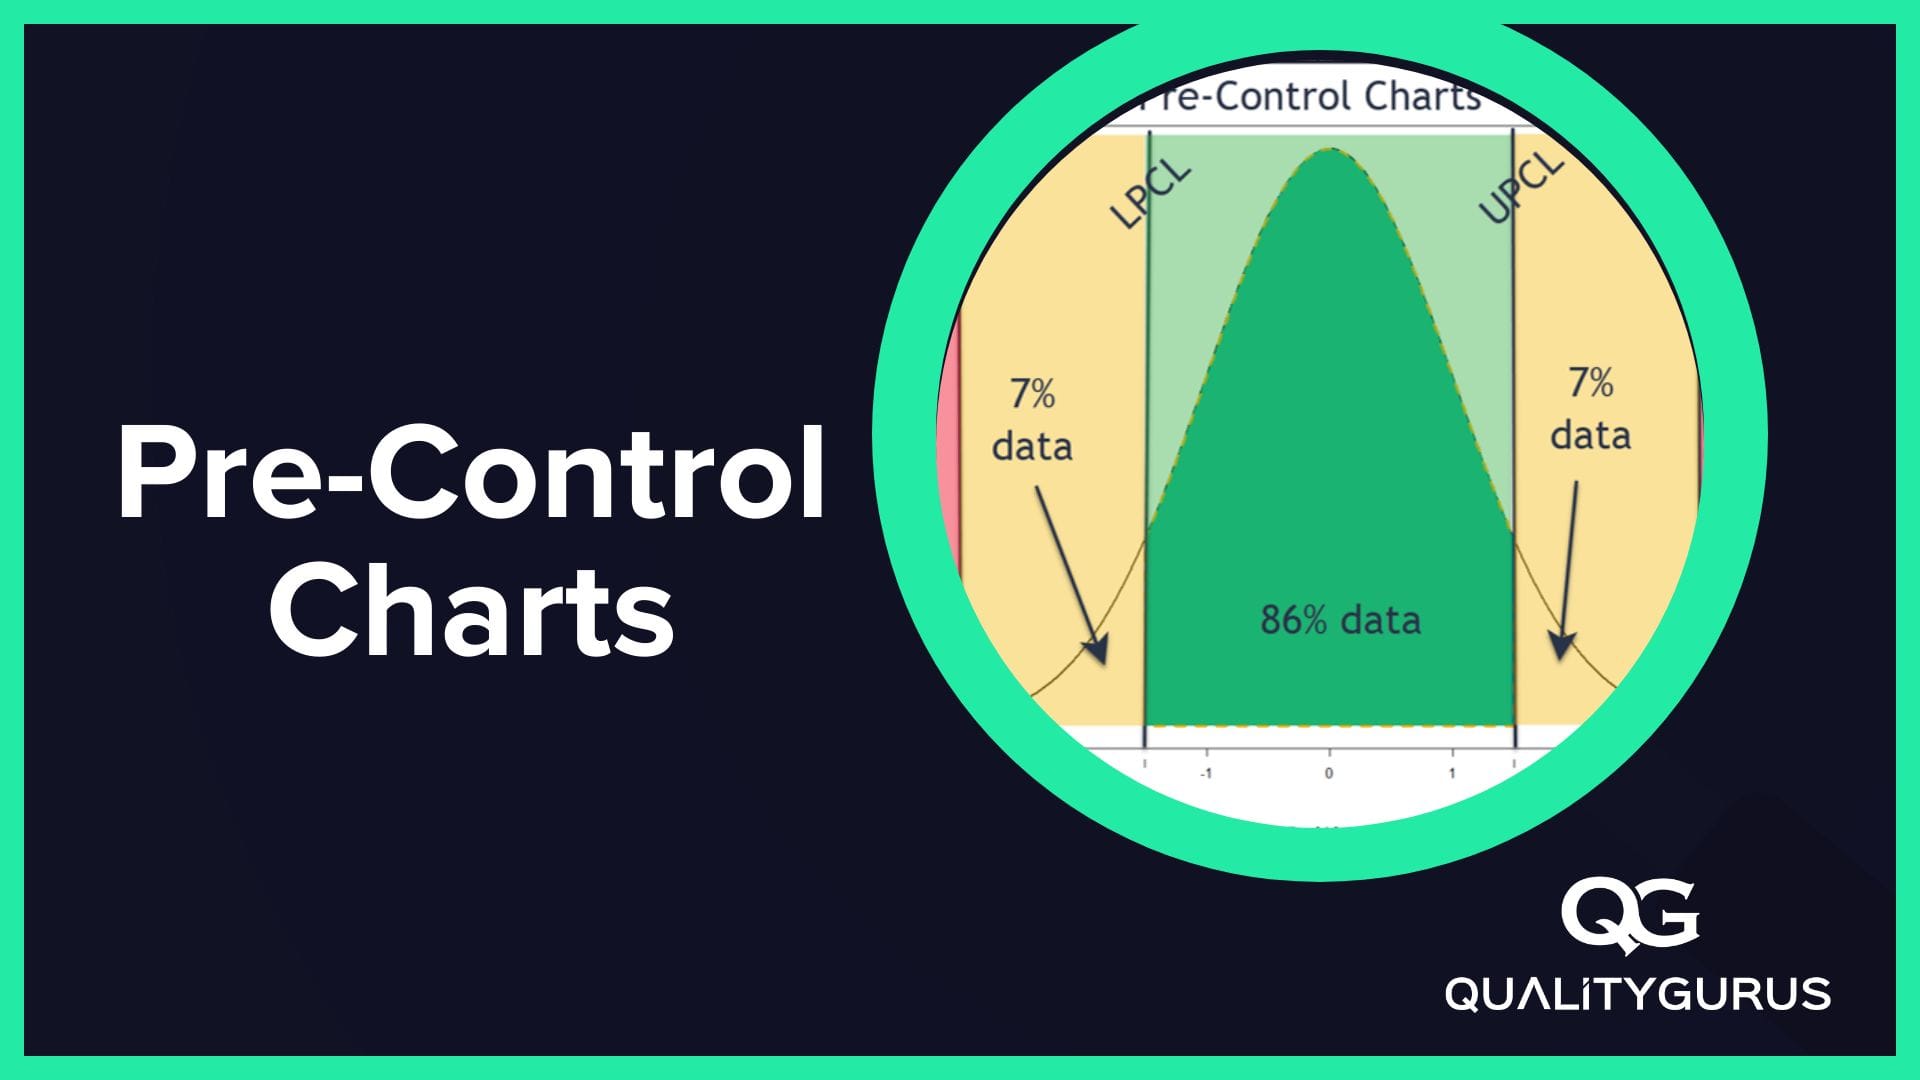
Since we do not have enough data to calculate the control limits, the control limits are set at the middle 50% of the tolerance. That is the Green Zone. Assuming a normal distribution, we should expect 86% of the values to fall in this zone.
The balance 25% of the tolerance on both sides is the Yellow Zone.

Set-up Phase
For the sampling process to start, 5 consecutive items should fall in the Green Zone. If the process is not in control, then it will be difficult to get 5 consecutive items in the middle 50% of the specification limits.
If the 5 consecutive items do not fall in the Green Zone, you readjust the process.
Once you meet the requirement of 5 consecutive items in the Green Zone, you can move to the sampling process.
Sampling Phase
Periodically sample 2 items from the production.
If both of these items fall in the Green Zone, or one in Green and one in Yellow Zone, continue the process.
If both of these items fall in Yellow Zone, and Red Zone, readjust the process and go back to the Set-up Phase.
Statistical Process Control Bootcamp

Advantages:
They are easy to set up and maintain because no calculations are required.
Disadvantages:
Pre-Control Charts are a poor replacement of Statistical Process Control. They should only be used when SPC can not be used, such as at the initial period of a process, or for short runs.
Pre-Control Charts are less reliable as compared to SPC Control Charts and could lead to more Type I and Type II errors.
Difference Between Control Chart and Pre-Control Chart:
| Aspect | Pre-control Charts | Control Charts |
|---|---|---|
| Objective | Monitor production process for early detection of process shifts, allowing for prompt corrective actions. | Monitor and control process variation over time to ensure process stability and capability. |
| Data Points | Uses individual data points to determine if they are within specified control limits. | Uses subgroups or individual data points plotted over time to determine if the process is in control. |
| Control Limits | Control limits are based on product specifications or predetermined limits. | Control limits are based on statistical calculations using process data (±3 standard deviations). |
| Frequency of Data Collection | Data is collected frequently, typically at the beginning and end of a production run or shift. | Data is collected at regular intervals throughout the production process, depending on the process and control chart type. |
| Response to Out-of-control Conditions | Immediate corrective action is taken when data points fall outside pre-control limits. | Investigation and corrective action are taken when control chart rules are violated, such as a data point falling outside control limits or non-random patterns. |
| Statistical Assumptions | No specific statistical assumptions are made for pre-control charts. | Control charts assume a stable process and data points are independent and normally distributed. |