
Understanding First Time Yield (FTY) and Rolled Throughput Yield (RTY)
In quality management and process improvement, understanding the efficiency of a process is crucial. Two fundamental metrics used to assess process effectiveness are First Time Yield (FTY) and Rolled Throughput Yield (RTY). This blog post explains these concepts clearly, with calculation methods, examples, and comparisons.
What is First Time Yield (FTY)?
First Time Yield, also known as First Pass Yield, measures the percentage of units that pass through a process correctly the first time, without rework or repairs. It is an important indicator of process quality and efficiency.
How to Calculate First Time Yield
The formula for calculating FTY is straightforward:
$$FTY = \frac{\text{Number of Good Units Produced the First Time}}{\text{Total Units Entering the Process}} \times 100$$
Example of First Time Yield Calculation
Suppose a manufacturing process has produced 1,000 units. Out of these, 950 units were completed correctly on the first attempt without any rework.
$$FTY = \frac{950}{1000} \times 100 = 95\%$$
This indicates that 95% of the units passed through the process successfully on the first attempt.
What is Rolled Throughput Yield (RTY)?
Rolled Throughput Yield considers the yield across multiple process steps or stages, measuring the likelihood that a unit passes through all steps without defects. Unlike FTY, RTY accounts for the compounded effect of yield losses at each stage of the process.
How to Calculate Rolled Throughput Yield
The formula for calculating RTY across multiple processes is:
$$RTY = FTY_1 \times FTY_2 \times \dots \times FTY_n$$
Where \(FTY_1, FTY_2, \dots, FTY_n\) are the First Time Yield values of each sequential step.
Example of Rolled Throughput Yield Calculation
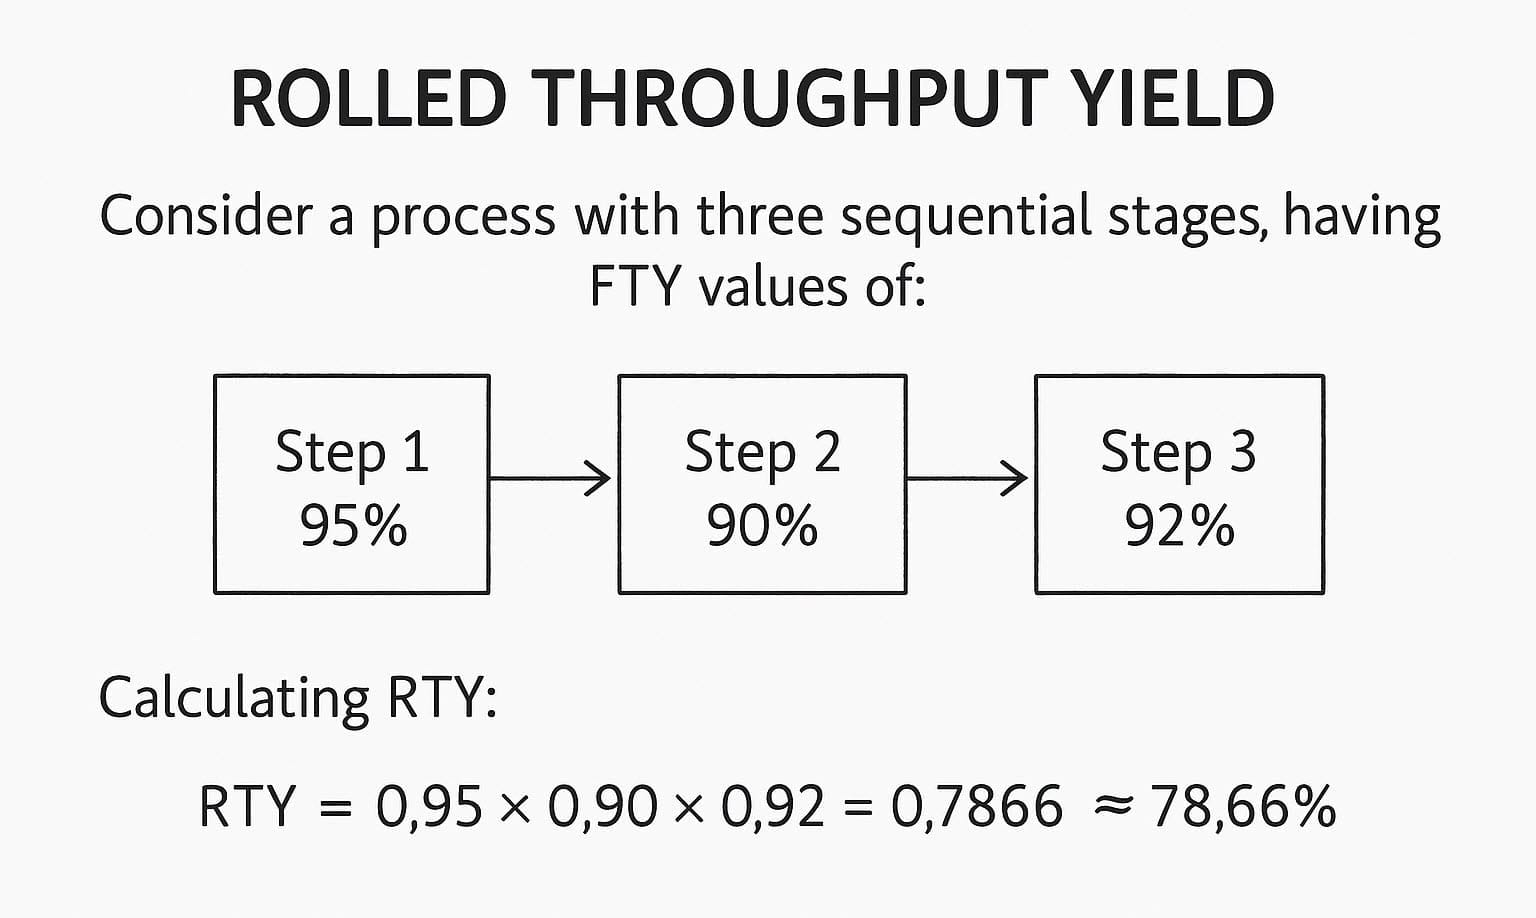
Consider a process with three sequential stages, having FTY values of:
- Step 1: 95%
- Step 2: 90%
- Step 3: 92%
Calculating RTY:
$$RTY = 0.95 \times 0.90 \times 0.92 = 0.7866 = 78.66\%$$
This indicates a 78.66% chance that a unit will pass through all stages without requiring rework.
Comparing FTY and RTY
While FTY measures individual step performance, RTY provides a comprehensive view of process quality over multiple steps. Even if individual process steps have high yields, the overall process yield can significantly decline due to compounding defects.
Key Differences:
- FTY provides insights into each individual stage but doesn’t reflect cumulative defects across multiple stages.
- RTY accounts for the compounded effect of defects, giving a realistic view of the entire process efficiency.
Practical Implications
Using both metrics helps identify:
- Individual process step issues (via FTY)
- Overall process performance and defect compounding (via RTY)
This dual perspective assists organizations in pinpointing critical process areas needing improvement, thereby reducing overall defects and increasing efficiency.
Conclusion
Monitoring and improving FTY and RTY are critical components of effective quality management. While FTY focuses on immediate process performance, RTY provides a holistic view, helping businesses ensure overall operational excellence and continuous improvement.