
C control charts are a valuable tool for monitoring the number of defects in a process. They help identify trends and variations in the process, which can lead to improved quality and efficiency. In this blog post, we will walk you through the process of creating a simple web app for generating C control charts, similar to our previous post on I-MR control charts.
What is a C Control Chart?
A C control chart is a statistical tool used to monitor the number of defects in a process over time. The C chart plots the count of defects in each sample on the y-axis, while the x-axis represents the sample number. The chart also includes a center line, which is the average count of defects, as well as upper and lower control limits (UCL and LCL) that indicate the expected range of variation in the process.
Formula Used:
In C control charts, the center line (CL) represents the average count of defects per sample. The upper control limit (UCL) and lower control limit (LCL) are calculated based on the average count of defects and the number of samples (n) using the following formulas:
- CL = Σ(count of defects per sample) / n
- UCL = CL + 3 * √CL
- LCL = CL - 3 * √CL (if LCL < 0, set LCL to 0)
How to Use the App:
To use the C control chart web app, follow these simple steps:
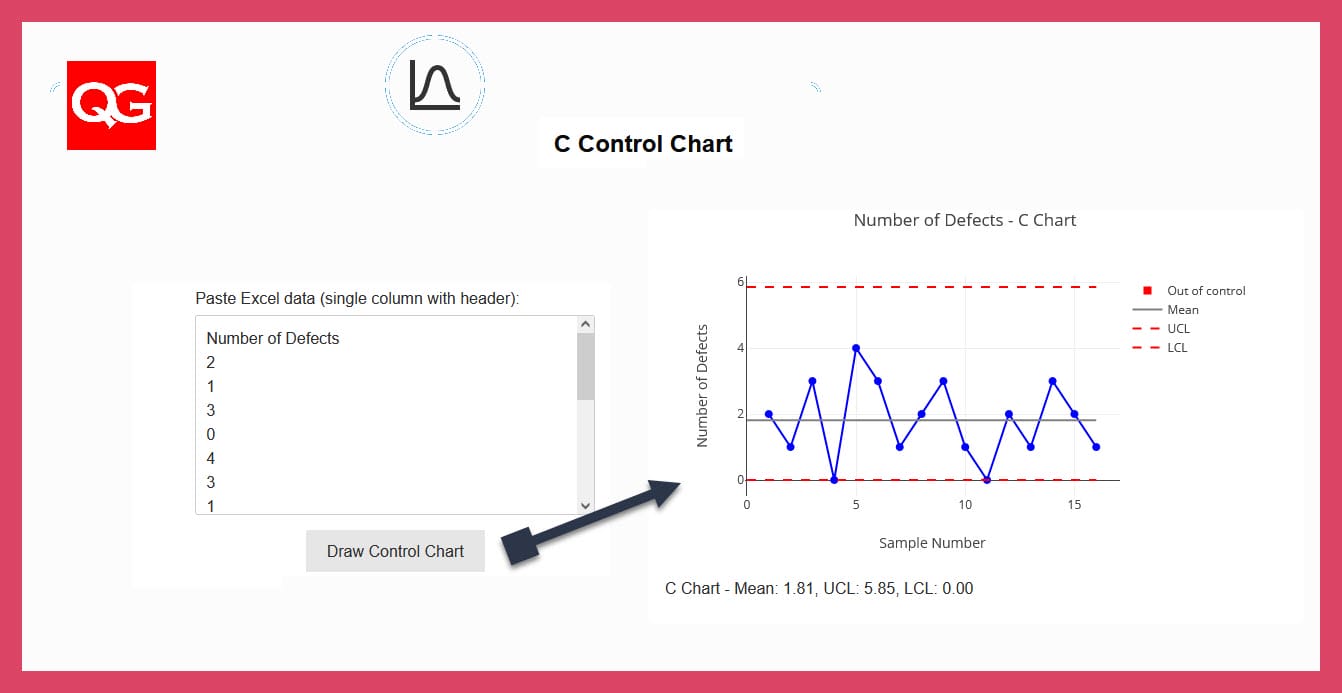
- Prepare your data in Excel, with a single column containing the count of defects per sample (including a header).
- Copy the data from Excel and paste it into the text area labeled "Paste Excel data (single column with header)" in the web app.
- Click the "Draw C Chart" button.
- The C control chart will be generated below the input form, displaying the count of defects per sample, along with the center line, UCL, and LCL.
The chart will help you visualize the process stability and detect any unusual patterns or trends. If any data points fall outside the control limits, it may indicate that the process is out of control and requires further investigation.
C Control Chart
Conclusion:
In this blog post, we have demonstrated how to create a simple C control chart web app using HTML, CSS, and JavaScript. By analyzing the count of defects in a process using C control charts, organizations can improve their understanding of process variation and work towards achieving better quality control and increased efficiency.