
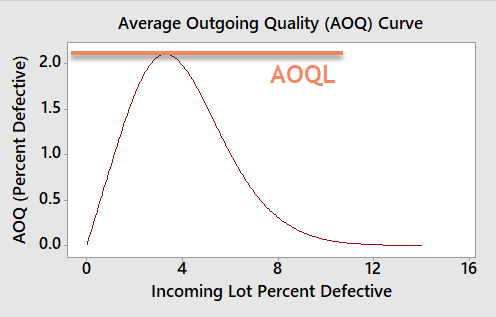
Average Outgoing Quality (AOQ) plot represents the relationship between the quality of incoming and outgoing materials.
When incoming lots are very good, the outgoing quality will be good.
When the incoming lot is very bad, then also the outgoing quality will be good because poor lots get reinspected and fixed.
See the graph showing the relationship between incoming quality and outgoing quality.
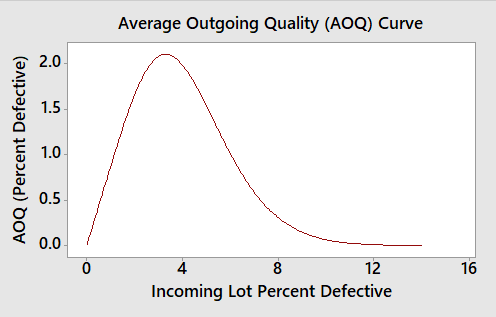
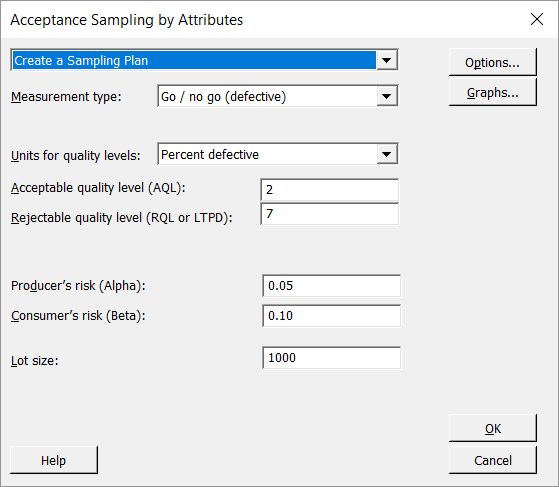
The above AOQ plot is made for the following inputs:
")
$200 $39.99
Certified Quality Engineer (ASQ CQE) Training
(80% off)
This course covers the Acceptance Sampling from basics to advance level, including AOQ, AOQL, OC Curve, LTPD, Z1.4 and Z1.9 standards, Dodge-Romig sampling tables and much more.
As we talked earlier that the Average Outgoing Quality (AOQ) is good in both conditions when input lot is too good or too bad. This is what you saw in the first picture above. But when incoming quality is neither too good or too bad, the outgoing quality gets worse. The maximum percent defective level for outgoing quality is called the Average Outgoing Quality Limit (AOQL). AOQL is the point at which the AOQ curve peaks.
