
Process improvement is an integral part of manufacturing. It is also a critical component of quality control. Identifying problems early and correcting them before they become costly issues is the key to success.
The origin of these tools can be traced back to the 15th century. This was when the monk named Benkei was said to have used them in his battles. The seven famous weapons are:
- The broad axe (masakari).
- A rake (kumade).
- A sickle (nagigama).
- A wooden mallet (hizuchi).
- A saw (nokogiri).
- An iron staff (tetsubō).
- A Japanese glaive (naginata).
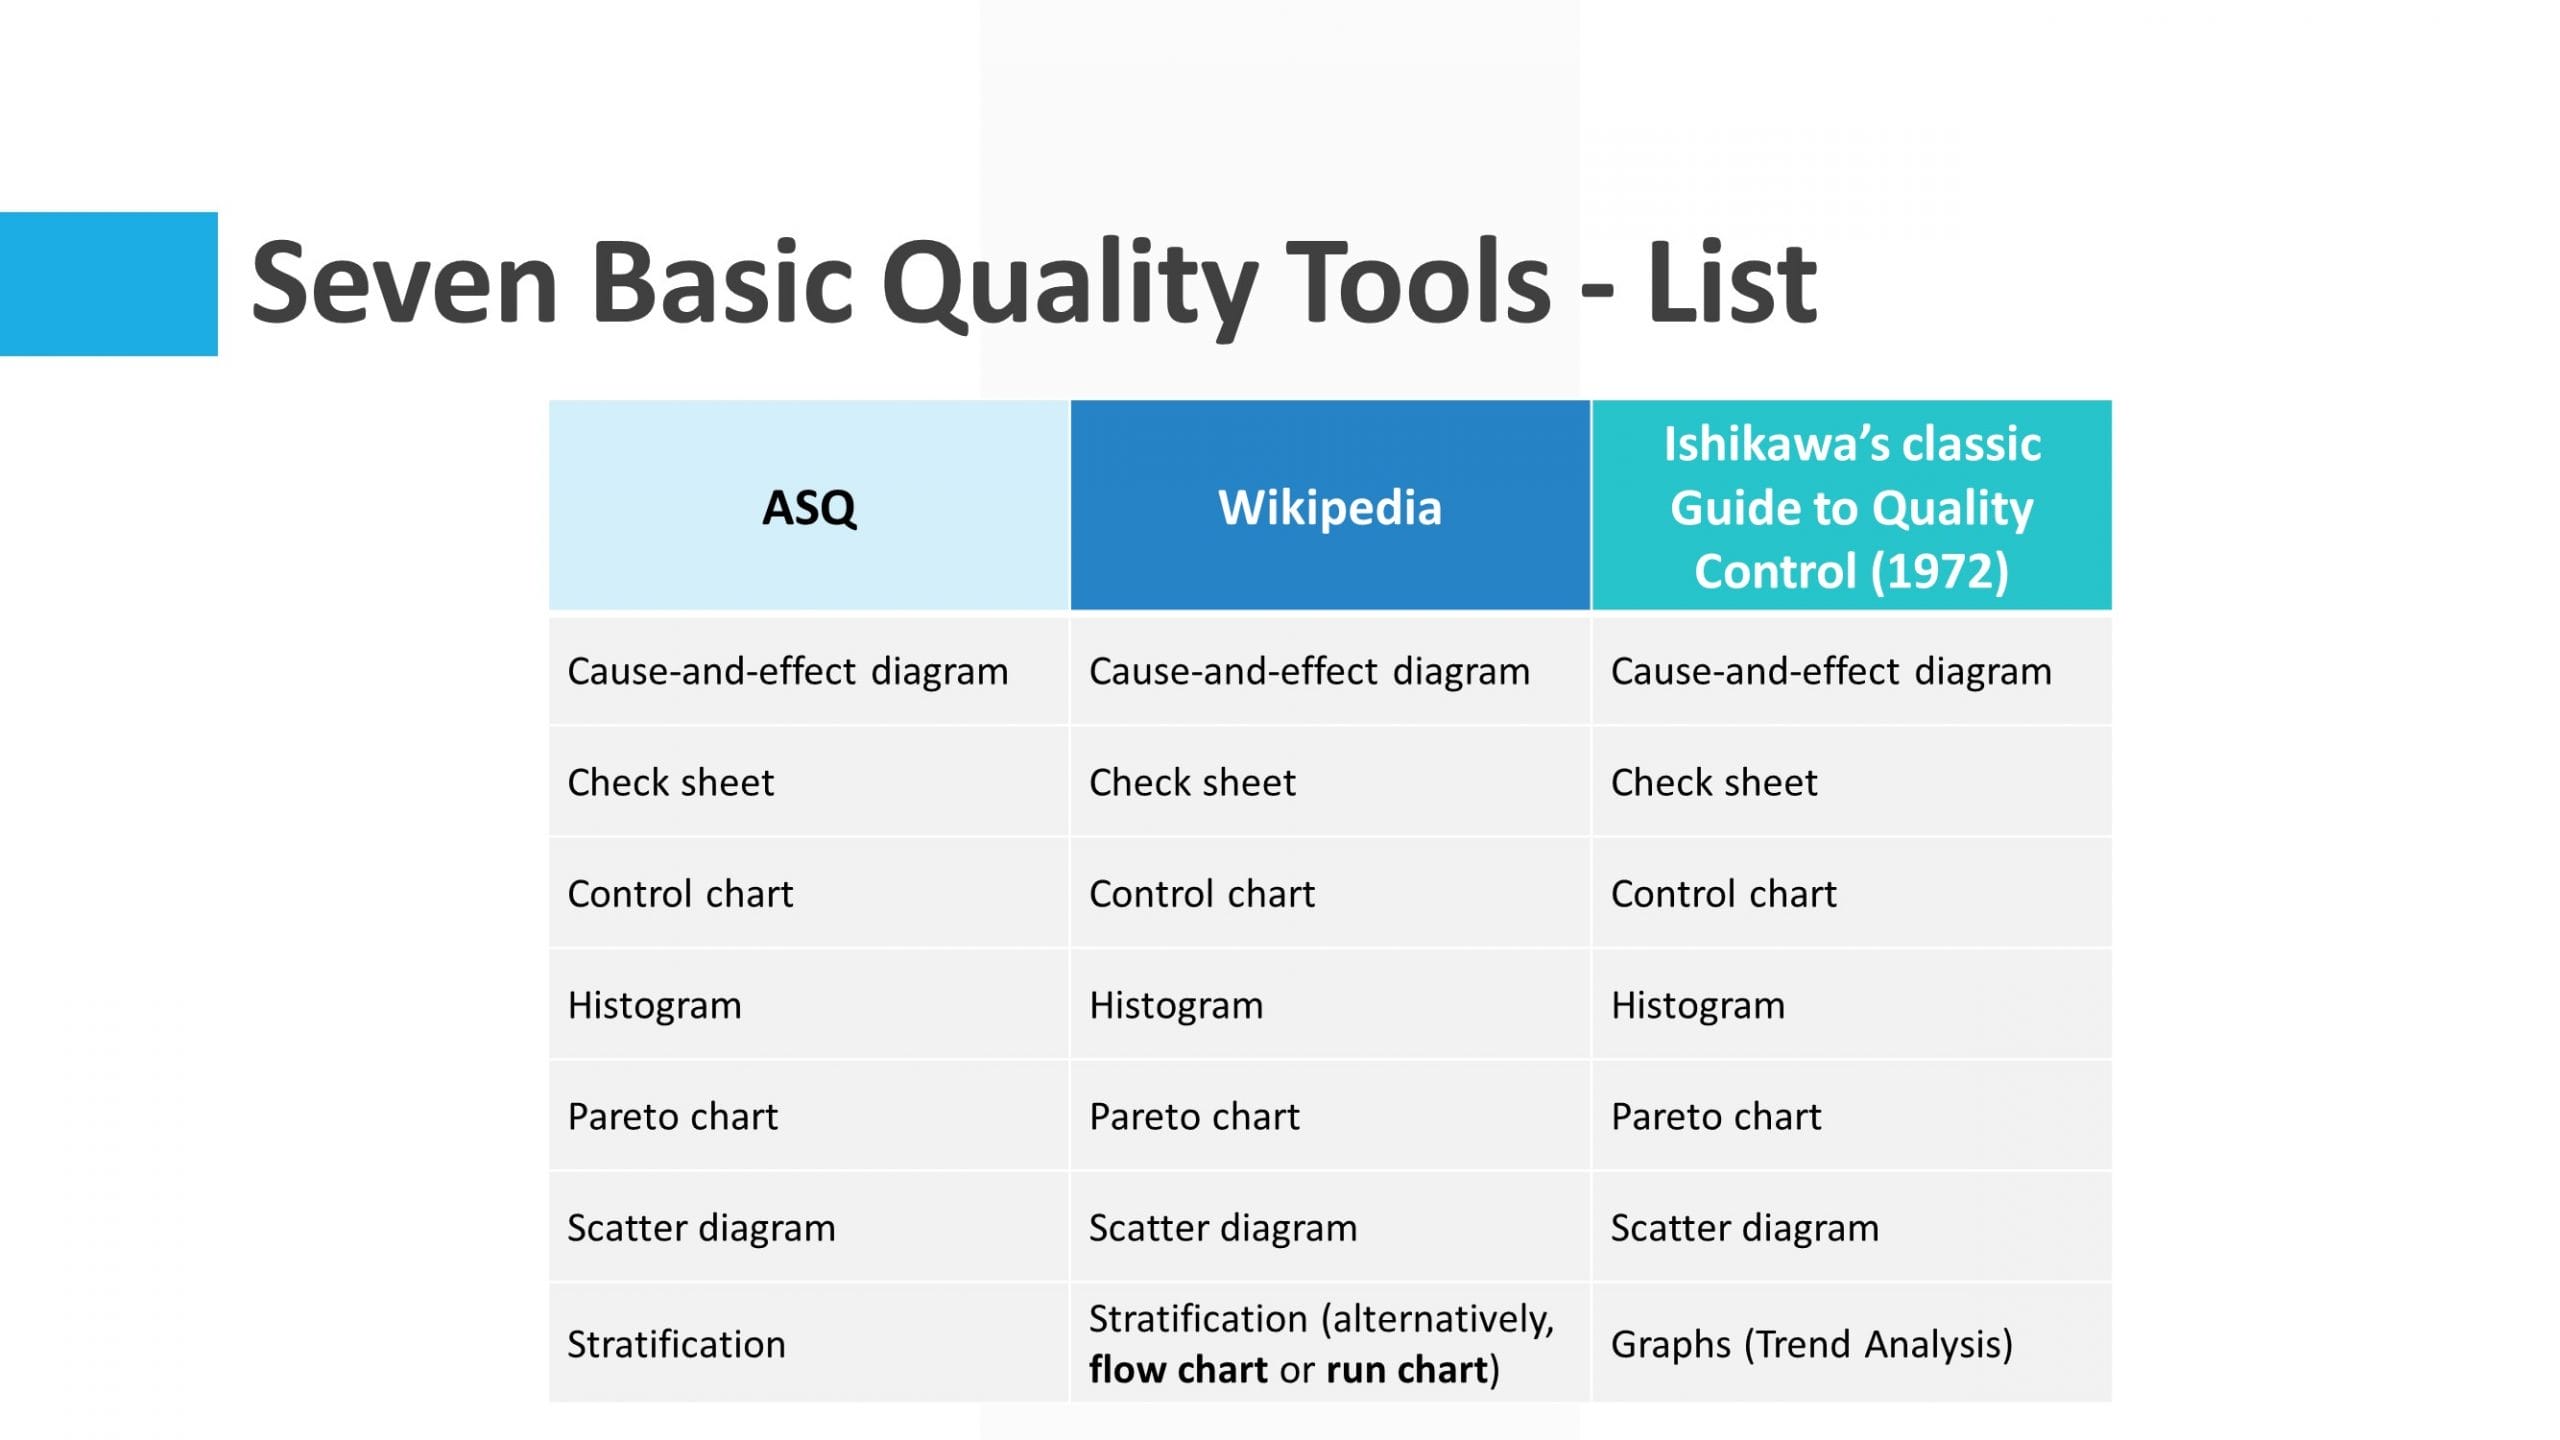
Japanese professor Kaoru Ishikawa originally developed the seven quality tools.
1. Cause-and-effect diagram
A cause-and-effect diagram is a diagram that shows the causes of a problem to establish the root cause of the problem. The cause and effects diagram is also known as the Fishbone Diagram or the Ishikawa Diagram.
2. Check sheet
The check sheet is a manual data collection tool. It is used to record quantitative measurements and communicate their status.
3. Control chart
Control charts help in identifying the special causes in the process. This tool helps in deciding when to take action and when not to take action.
4. Histogram
A histogram plots the pattern of variation in values.
5. Pareto chart
In Quality Management, it means that 20% of the errors result in 80% of the problems.
6. Scatter diagram
A Scatter Diagram shows the relationship between two variables. This tool helps in understanding how the change in one variable leads to the change in another variable.
7. Stratification
Stratification is a tool to make sense of a mixed set of data by splitting the data based on a particular parameter.
Seven Basic Quality Tools
