
Individuals and moving range (I-MR) control charts are powerful tools for monitoring the stability of a process. They are particularly useful when data is collected one sample at a time, instead of in subgroups. In this blog post, we will provide a brief explanation of I-MR charts, the formulas used, and how to use our I-MR Control Chart Tool effectively.
I-MR Chart Overview:
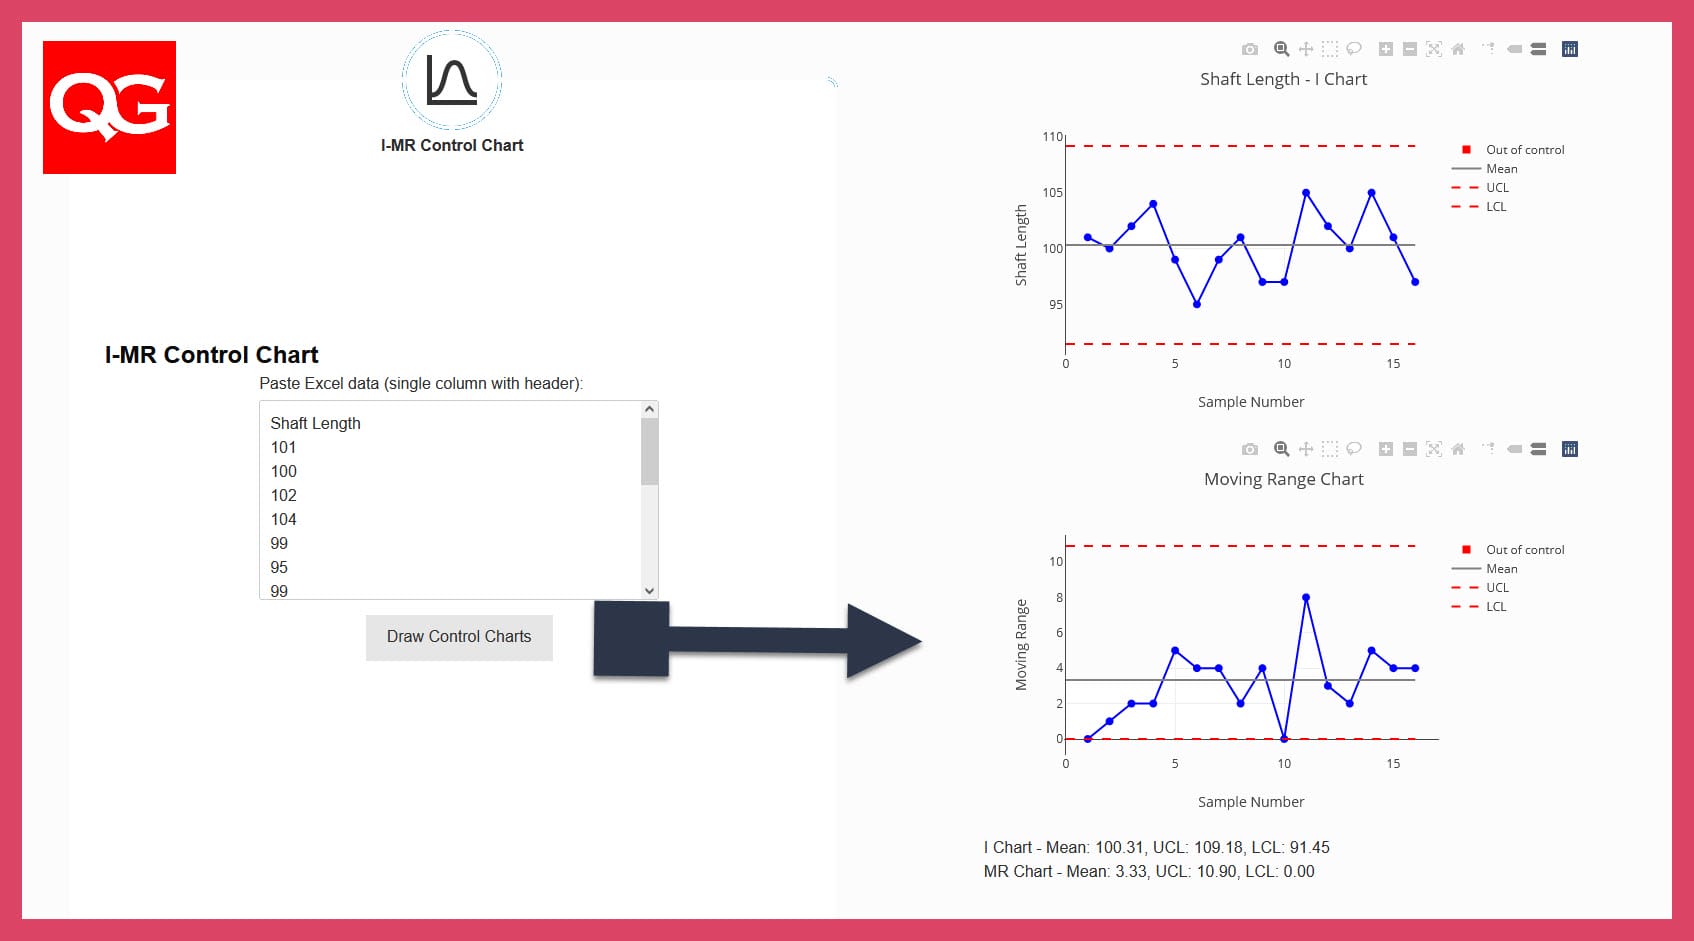
An I-MR control chart consists of two charts: the I chart and the MR chart. The I chart (Individuals Chart) plots individual data points over time, while the MR chart (Moving Range Chart) plots the moving range between consecutive data points. These charts help identify variations in a process that may be indicative of issues or areas for improvement.
Formulas Used:
- Center Line (CL) for I chart: Mean of individual data points.
- Upper Control Limit (UCL) for I chart: CL + 2.66 * Avg Moving Range.
- Lower Control Limit (LCL) for I chart: CL - 2.66 * Avg Moving Range (or 0 if negative).
- Center Line (CL) for MR chart: Mean of moving ranges.
- Upper Control Limit (UCL) for MR chart: 3.27 * Avg Moving Range.
- Lower Control Limit (LCL) for MR chart: 0.
Using Our I-MR Control Chart Tool:
Follow these steps to use our I-MR Control Chart Tool effectively:
Prepare your data: Ensure that you have a single column of data, including a header (e.g., "Shaft Length"). The data should be formatted as text, with each value separated by a newline.
Paste your data: In the tool, locate the textarea labeled "Paste Excel data (single column with header):" and paste your data into the text area.
Click "Draw Control Charts": Once your data is pasted, click the "Draw Control Charts" button to generate the I-MR charts based on your data.
Analyze the charts: Examine the I and MR charts to identify any points that are out of control (i.e., outside the control limits). These points are marked with red squares. Investigate these points for possible causes of variation and take corrective action as needed.
Monitor the process: Continue to collect data and update the charts to monitor the ongoing stability of the process.
I-MR Control Chart Plotting Tool:
I-MR Control Chart
I-MR Control Chart
Conclusion:
I-MR charts are valuable tools for monitoring process stability, especially when data is collected one sample at a time. By using our I-MR Control Chart Tool, you can quickly and easily generate I-MR charts to analyze your process data and identify opportunities for improvement.